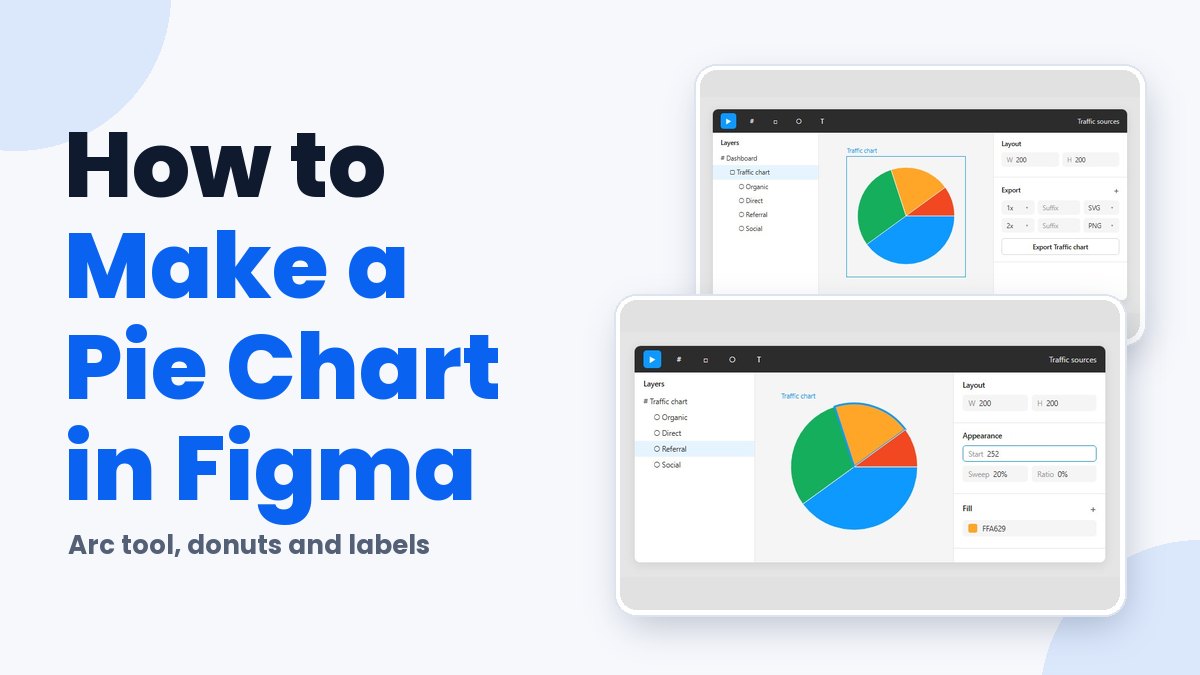
Figma has no native chart tool, so a pie chart starts with an ellipse and its arc controls. Sweep sets how big each slice is and Start says where it begins. Ratio stays at 0. The other route is a Community plugin that works out the angles from pasted CSV or JSON data.
The arc method suits dashboards and decks with a handful of static slices. If your numbers live in a spreadsheet, a plugin makes more sense.
Sweep takes a percentage but Start takes degrees, which trips people up. Each slice’s Start equals 360 times the combined share of the slices before it. Split a chart 40, 30, 20 and 10 percent and the slices start at 0, 144, 252 and 324 degrees.
Does Figma Have a Built-In Pie Chart Tool?
Not as of October 2026. Figma’s Help Center documents no chart tool in Figma Design, so a pie chart comes from an ellipse with arc controls or from a Community plugin.
The Arc tool is the nearest thing to native support. Its Help Center page lists pie charts among the shapes the arc controls produce, and it works on every plan.
A few tutorials claim more than that. One site describes a Pie tool in the left toolbar, and a Trupeer walkthrough begins from the Actions menu. Figma’s own documentation routes pie charts through the Ellipse tool instead, and a forum thread from May 2025 still asks Figma for native pie, donut, line and bar charts with CSV import and editable data.
| Method | Precision | Data input | Best for |
|---|---|---|---|
| Arc tool | Exact, typed values | Entered by hand, slice by slice | A few static slices |
| Community plugin | Exact, calculated from data | Table, CSV or Google Sheets, depending on the plugin | Charts fed by a spreadsheet |
| Pen tool and mask | By eye | None | Nothing the arc tool cannot do better |
Why the pen and mask method loses
The older Prototypr walkthrough draws a polygon per slice with the pen tool, then clips the result with a circular mask.
Slice edges land wherever you click. The walkthrough places them by eye, so a 20% slice is only roughly 20%.
My rule is plain enough. Use arcs when there are a handful of slices that rarely change, and a plugin when the numbers live in a spreadsheet.
How to Make a Pie Chart in Figma With the Arc Tool
Draw an ellipse and hover over it until the Arc handle shows up. Dragging that handle opens the Sweep, Start and Ratio controls. From there, duplicate the arc once per slice, set each slice’s values in the right sidebar, and keep Ratio at 0.
Have you seen the latest Figma statistics?
Discover comprehensive Figma statistics including revenue growth, market share, user demographics, and funding data.
Check them out →You need edit access to the file for the arc tool to work. Create a frame first so the slices and their labels move as one unit.
- Press O to pick the Ellipse tool, then drag on the canvas while holding Shift to lock a perfect circle.
- Select the circle and hover over it. A single handle appears on the right edge.
- Drag that Arc handle up or down. Three handles now show: Sweep, Start and Ratio.
- In the Appearance section of the right sidebar, type the Sweep as a percentage of the circle.
- Leave Ratio at 0 so the slice reaches the center.
- Duplicate the arc with Ctrl+D (Windows) or Cmd+D (Mac), one copy per remaining slice.
- Give every duplicate its own Start and Sweep, fill each with a distinct color, then group the slices.
Typing values beats dragging
Dragging gets you close but never lands on an exact percentage. The sidebar fields accept typed values, and simple math works inside them, according to Tobamese’s Figma arc tutorial on Medium.
Sometimes the sweep comes out negative. Figma’s tooltip shows a positive percentage when the handle moves up and a negative one when it moves down, so type a positive value to correct it.
How to Calculate Sweep and Start Values for Each Slice
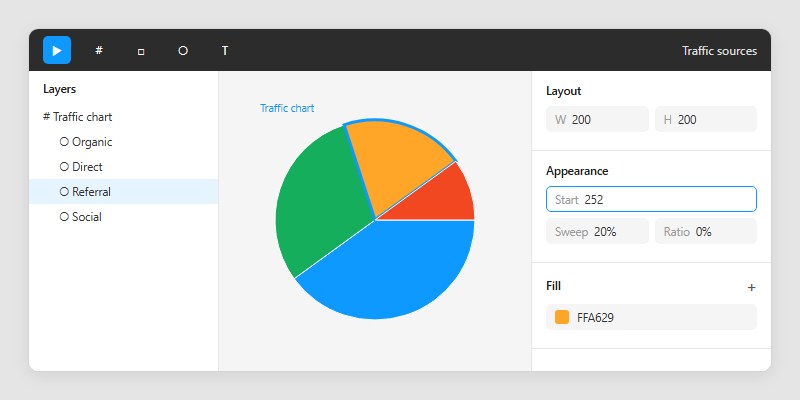
A slice’s sweep is just its share of the total. Its start is 360 times the combined share of every slice before it.
Figma shows sweep as a percentage of the circle, so a 40% slice takes 40 in the Sweep field. Start takes degrees, hence the 360 multiplier.
| Slice (example data) | Share | Sweep | Start |
|---|---|---|---|
| Organic | 40% | 40% | 0 |
| Direct | 30% | 30% | 144 |
| Referral | 20% | 20% | 252 |
| Social | 10% | 10% | 324 |
Direct starts at 0.4 x 360 = 144, and Referral at 0.7 x 360 = 252. Social comes last, at 0.9 x 360 = 324.
That is the same formula the Medium tutorial applies, and the sidebar accepts it as typed math. Entering 360*0.7 in the Start field works without a calculator.
Which way the slices run
Figma’s developer documentation defines arc angles in radians, with 0 on the x axis and angles increasing clockwise. The Help Center puts the zero point on the handle at the right edge of the circle.
So the first slice begins at 3 o’clock and every later slice follows clockwise. To start at 12 o’clock instead, rotate the finished group a quarter turn counterclockwise.
- Shares that do not sum to exactly 100 leave a gap or an overlap. Three values of 33.3 only reach 99.9, so round them as 33.3, 33.3 and 33.4 before typing
- Every Start depends on all the slices before it, so re-check them after reordering slices
How to Make a Donut Chart in Figma
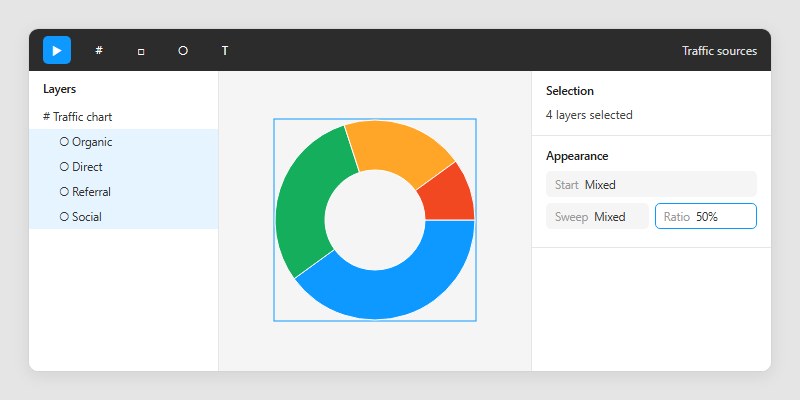
Set the same Ratio on every slice, 50% for example, and the pie becomes a donut. Start and Sweep stay exactly as calculated.
A progress ring uses start 0, sweep 75% and ratio 85%, laid over a base ring with start 0, sweep 100% and ratio 75% (Design Code, The Figma Handbook).
Figma’s developer documentation describes the same shape in code. A donut is an ellipse with a full sweep and an inner radius of 0.5, on a scale from 0 to 1.
Apply one ratio to all slices
Select every slice and edit Ratio once. The sidebar supports batch edits, so all the arcs change together.
Skip this and the ring ends up with slightly different thicknesses, a mismatch that is easy to notice and hard to name.
Finishing touches
- The inspector exposes a corner radius, which gives the slice ends rounded corners
- A text layer in the hole can carry the total or the key value
How to Make a Pie Chart in Figma With a Plugin
Run a chart plugin from Figma Community, paste or import your data, pick the pie type, and insert the result into a selected frame. The plugin calculates the angles, so you never type a Sweep or Start value yourself.
Pasted tables, CSV and JSON are the usual inputs, and some listings add Google Sheets import. When your numbers sit in CSV but a plugin wants JSON, a quick CSV to JSON converter closes the gap.
UCharts
UCharts imports Excel and CSV data (or pasted data) and offers 20+ chart types. Exports go out as PNG, SVG, PDF or HTML5, according to its Figma Community listing. The developer’s forum post from May 2026 claims nearly 40,000 users, while the listing text cites 27,000+.
It is listed as free on Figma Community, and accepting Excel, CSV or pasted data covers most situations. The downsides are small but real. The listing does not say whether an inserted chart can be reopened and edited, and a toolset this broad is heavy for one pie.
Highcharts Core Figma Plugin
Highsoft released version 1.0 as a free Community plugin (Highcharts blog, 2024). The Community listing now reads Charts+ (by Highcharts) and adds live resizing and Figma Slides support.
Pie and donut sit among its 7 chart types, and data goes in as comma-separated values through the Data tab. To change the chart type or series later, select the parent frame and relaunch the plugin. Colors follow Figma local variables, so light and dark themes switch together.
On the downside, a frame has to be selected before a chart can be inserted. Highcharts also notes that Figma’s free tier allows one theme mode only, so theme switching needs a higher tier.
The plugin is built by a charting-library vendor, which shows in the hand-off to developers.
Chart Studio
Chart Studio’s developer lists 12 free chart types out of 43, with pie and donut in the free set (Figma forum post, October 11, 2026).
| Works well | Falls short |
|---|---|
| Pie and donut insert without limits or watermarks | Google Sheets and XLSX imports sit behind a one-time Pro purchase |
| Accepts a pasted table, CSV or JSON | Fonts it cannot load fall back to Inter |
| Core editing and local imports run on your device | Optional AI features bill through your own provider and API key |
For a single pie, the free tier covers the job.
How to Style Slices, Labels and Legend
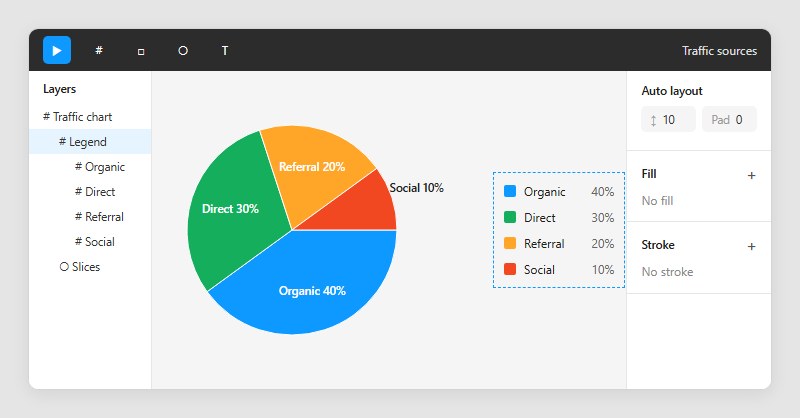
Fill each slice with a distinct color, label every slice with its name and value, and build the legend from swatch and text pairs. WCAG 2.2 asks for 3:1 contrast between slices unless the values are printed on the chart.
W3C’s guidance on Success Criterion 1.4.11, Non-text Contrast (Level AA, updated September 2026), treats pie slices as graphical objects whenever a reader needs them to understand the chart.
| Chart as built | 1.4.11 result |
|---|---|
| Slice names shown but no values, slice contrast under 3:1 | Fail |
| Names and values printed on the chart | Not applicable |
| Slice contrast 3:1 or higher, dark border on pale slices | Pass |
W3C’s passing pie example adds a darker border around a yellow slice. In Figma, that is a stroke on the arc.
Text on or beside slices follows a separate rule, so check the color contrast of every label against the fill or background behind it.
Labels and legend
Put the name and value on one text layer, inside large slices and outside small ones.
Legend rows work best as a square swatch plus a text layer, stacked in auto layout so spacing holds when a label grows. Keep the order matching the slices, clockwise from the first one.
Matching slice colors to a design system
Figma’s color variables apply to fill and stroke colors, per the Figma Help Center, so each slice can bind to a named color. Variable modes hold one value per variable for each mode, which lets light and dark themes share a single chart.
Create a collection with Light and Dark modes, bind every slice fill and stroke to it, then switch the frame’s mode. Collections and modes are covered in this guide to Figma variables.
How to Export and Reuse a Pie Chart
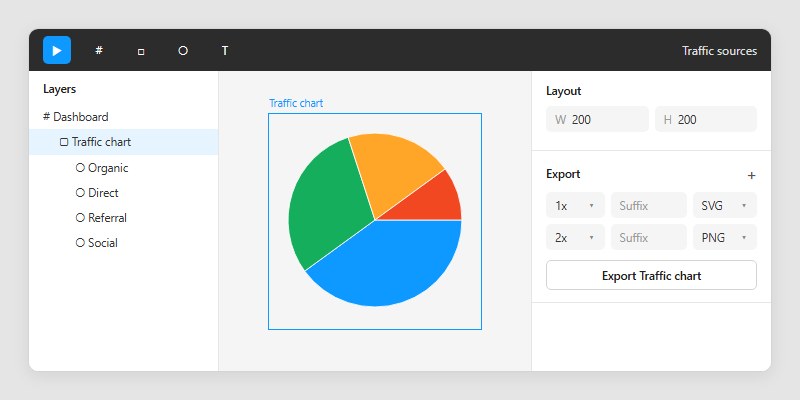
Select the grouped chart, add an export setting in the right sidebar, and pick SVG for a scalable vector or PNG for a raster image. To reuse the chart, convert the group to a component.
For a single export, select the group, frame or component, click the plus in the Export section near the bottom of the right sidebar, choose a format, then click Export. If you only need a quick copy, right-click the chart, hover Copy/Paste as, and choose Copy as PNG or Copy as SVG.
Bulk export is Shift+Cmd+E on Mac or Shift+Ctrl+E on Windows, and it exports every selection on the page that carries an export setting.
Export works on any plan, and anyone with view access can export unless the file owner restricted copying and sharing (Figma Help Center).
Choose SVG when the chart must stay sharp at any size, and PNG when the destination cannot render vectors. This comparison of SVG and PNG files covers the trade-offs.
If the chart sits in a filled frame, untick Show in exports under Fill to drop the background from the file.
Reusing the chart as a component
A main component defines the chart, and every instance stays linked to it and receives its updates, according to the Figma Help Center. Components are available on all plans.
That suits a dashboard that repeats one chart style, because a change to the main component reaches every card. Instances can override properties such as fills and label text, and this walkthrough on using components in Figma shows the setup.
When the Figma Pie Chart Methods Break Down
Both methods stop working when the chart has to follow changing data. Arc values are typed by hand, and plugin charts stay in sync only as far as each plugin allows.
Arc values do not follow data
A Figma forum request from July 31, 2024 asks for variables on arc Start, Sweep and Ratio, so a resizable component could change its angles. A Figma community support reply on August 21, 2024 said only that the idea would be passed to the team.
No Figma documentation reviewed in October 2026 shows arc fields bound to variables.
Plugin charts and source files
Chart Studio’s online imports run once with no automatic sync, and inserting again creates a new chart instead of overwriting the old one (developer post, October 2026). The Highcharts plugin saves pasted datasets inside the plugin, and selecting the parent frame then relaunching it edits the existing chart (Highcharts blog).
The two describe different edit behavior, so test one full update cycle before building a recurring report on either.
Figma Slides
Native charts in Figma Slides were still a request in the forum thread opened June 27, 2024, which asks for line and pie charts. A reply dated May 28, 2025 in the separate chart-tool thread says one team is stuck using Keynote for reports.
Plugins fill the gap. Charts+ (by Highcharts) lists Figma Slides support, and Figma’s own Slides page points to plugins for charts.
Pie Chart in Figma FAQ
Can I use the arc tool on a free Figma plan?
Yes. The arc tool is available on all plans, though drawing one needs edit access to the file (Figma Help Center).
People with view access cannot draw arcs, but they can still export the finished chart.
Can I make a pie chart in FigJam?
Not with a built-in chart tool. FigJam’s documented shape list has no pie, and FigJam AI generates flow charts, Gantt charts and org charts, among other diagrams (Figma Help Center).
A Community chart plugin that lists FigJam support covers the gap, so check the listing’s supported editors before installing.
How many slices can a pie chart have before it gets hard to read?
Sources disagree. Elastic’s UI guidelines cap pie charts at 6 slices, while Everviz recommends a maximum of 4.
Past your limit, merge the small categories into an Other slice. Check that Other does not become the largest slice, because that hides the point of the chart.
Can I animate a pie chart in Figma?
Partly, in Figma Motion. Figma’s loading-animation project there animates a ring built with the Arc tool using keyframes and path trim.
Path trim only works on center-positioned strokes (Figma Help Center), so a filled pie slice needs a different approach. Test one slice before promising an animated chart.
Keeping a Pie Chart in Figma Accurate as Numbers Change
Choose a plugin that stores its dataset for any pie chart in Figma that changes monthly, and keep the arc tool for fixed charts. Of the 3 plugins covered, only Highcharts documents re-editing an existing chart in place.
Chart Studio keeps data and styles in the inserted node’s metadata, so they travel with the file (developer post, October 2026). The Highcharts blog does not say where its saved datasets live, so open the file from a second account before sharing it.
The trade-off is dependency. A plugin chart relies on a third-party listing staying available, while arc shapes rely on nothing outside the file.
This was verified on October 27, 2026. Native charts in Figma, or variables bound to arc Start, Sweep and Ratio, would reverse the plugin recommendation.
When the chart is final, this guide to using Figma for client presentations covers showing it to a client.

Many of his resources are available on various design marketplaces. Over the years, he's worked with a range of clients and contributed to design publications like Designmodo, WebDesignerDepot, and Speckyboy, Slider Revolution among others.
- How to Make a Pie Chart in Figma Without Plugins - November 14, 2026
- How to Export Frames in Figma Without Losing Quality - November 12, 2026
- How to Export From Figma [Step-by-Step Guide] - November 10, 2026